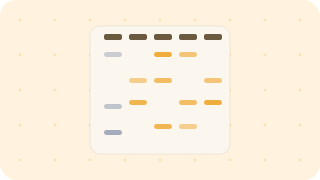
● Free · no install · no sign-up

From bench results
to slides and publication figures — in 5 minutes.

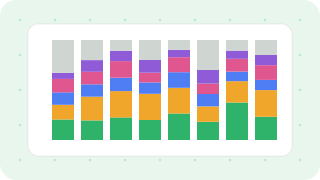
Western blot and qPCR quantification, statistics and IC50, RNA-seq and 16S, primer design and cloning — 13 lab analysis tools plus guides and protocols. Upload your results for values, statistics and publication-ready graphs; every calculation stays in your browser.

🔒 No uploads — files never leave your browser 📊 Publication-ready charts PNG · CSV export 🧪 Try instantly with example data
Tools

Pick an analysis. Every tool has example data, so you can try it without your own files.

Already using Image Lab or ImageJ?

Keep imaging and quantifying in the software you know. WetLab Kit takes over the next step — building lab-meeting slides and publication figures.

Bring your numbers as they arePaste values from Image Lab or ImageJ and get normalization, charts, t-tests, the figure and a PPT automatically.Retyping into Excel, charting in Prism
Type labels onceLane names, ± conditions, kDa and antibody details flow into the figure, the PPT and the Methods text at the same time.Re-typing PPT text boxes every time
PI edits in a minuteOpen the project file, fix a label, and the figure and PPT are rebuilt. Start the next set from a template.Re-assembling the figure from scratch
Pre-submission checkFlags saturated bands, uneven loading, non-linear brightness changes and missing kDa labels, and adds the uncropped original blots journals ask for.Hunting for raw blots after review

How it works

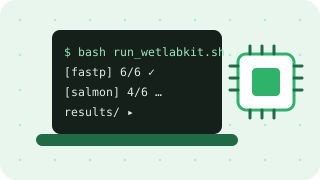
All you need is a browser — no software, no code.

Drop your filesBlot images, Ct result files or fluorescence images — drag them in or paste from Excel.
Review and adjustCheck the detected regions, groups and reference genes, and fix anything you need.
Get resultsSave quantification tables, statistics and publication-ready charts as CSV and PNG.

Interactive protocols

Step-by-step checklists plus simulators: change conditions such as gel %, antibody dilution or template amount and compare what happens. All protocols →

Protocol

Western blot SDS-PAGE → transfer → detection

Separate proteins by size (SDS-PAGE), move them onto a membrane (transfer) and find one protein with antibodies. The skeleton rarely changes, but gel %, loading amount, antibody dilution and transfer conditions are adjusted for every experiment — use the "Variable explorer" below to see what each change does.

Open →
Protocol

SYBR Green qPCR

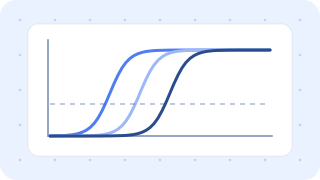
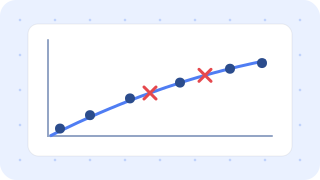
SYBR dye fluorescence rises as DNA doubles each cycle; the cycle where it crosses a threshold (Ct) compares starting amounts. Halving the template delays Ct by about one cycle.

Open →
Protocol

Sandwich ELISA

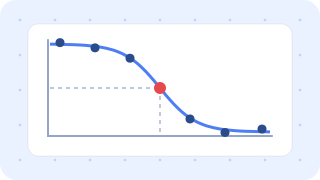
The target is sandwiched between a plate-bound capture antibody and a detection antibody, then quantified by an enzyme colour reaction. The standard curve is S-shaped, so diluting samples into its middle is the key step.

Open →
Protocol

MTT / CCK-8 cell viability

Metabolically active cells convert a reagent into a coloured product; its absorbance compares viability. The key is choosing cell number and incubation so the control is neither too faint nor saturated.

Open →
Protocol

Passaging adherent cells

When a vessel fills up, detach the cells and move a fraction into a new vessel. The split ratio sets when you will split next, and trypsin exposure affects cell health.

Open →
Protocol

Immunofluorescence staining

Fix cells, permeabilise membranes and detect the target with fluorescent antibodies. The right fixation and permeabilisation depend on the target, so compare two methods side by side at first.

Open →

Buffer & reagent recipes

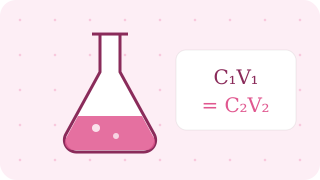
Everyday solutions like PBS, TBS, RIPA and TAE, calculated for any volume. All recipes →

Analysis guides

How the calculations work and common mistakes, with worked examples. All guides →

qPCR

How to Calculate qPCR ΔΔCt

A step-by-step guide to the 2^-ΔΔCt (Livak) method for qPCR relative quantification — ΔCt, ΔΔCt and fold change with a worked example, replicates and common mistakes.

Read →
Western blot

Western Blot Densitometry

The full western blot densitometry workflow — integrated density, background subtraction, loading-control normalization, values relative to a reference lane, and replicate statistics — with a worked example.

Read →
Lab statistics & calculations

t-test, ANOVA or Mann–Whitney? How to Choose a Statistical Test for Lab Data

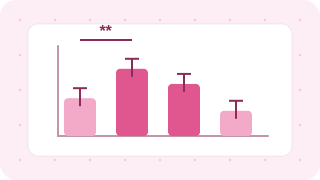
One table for choosing between t-test, Welch, paired t-test, ANOVA (Tukey, Dunnett), Mann–Whitney and Kruskal–Wallis by number of groups, pairing, normality and variance — plus pitfalls at n = 3.

Read →
RNA-seq

How to Read RNA-seq DEG Results

What log2 fold change, p-value, FDR (padj) and baseMean mean in RNA-seq results, how to choose DEG cut-offs, replicates and low-expression filters, and common mistakes such as Excel mangling gene names.

Read →
Primers, BLAST & cloning

How to Design PCR Primers

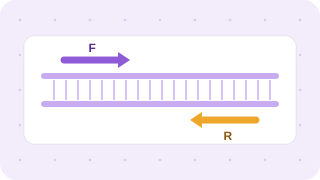
Length, GC, Tm and 3′-end rules for PCR primers, avoiding primer dimers and hairpins, how qPCR primers (product size, exon junctions, efficiency) differ from cloning primers (restriction sites, Gibson overlaps), plus ordering and resuspension.

Read →
Primers, BLAST & cloning

Cloning Methods Compared

How restriction cloning, Gibson/HiFi/In-Fusion assembly, Golden Gate, TA/TOPO and Gateway work, compared on scars, multi-fragment assembly, cost and time — plus which to choose, how to verify clones (colony PCR, diagnostic digest, sequencing) and common failures.

Read →

Frequently asked questions

What first-time users ask most.

Is it really free, with no install or sign-up?

Yes. It is a free tool that runs directly in your web browser — no installation, sign-up or login.

Is my data uploaded to a server or sent anywhere?

No. Every calculation runs inside your browser, and the site’s security policy blocks any outgoing transfer. Nothing is kept after you close the tab (project files are saved only to your own computer).

Should I use ΔΔCt or Pfaffl for qPCR?

If you did not measure primer efficiencies, use the widely used 2−ΔΔCt (Livak) method; if you measured them with a standard curve, use the efficiency-corrected Pfaffl method. The tool picks recommended settings for your data automatically.

Can I use western blot values from Image Lab or ImageJ?

Yes. Paste your values and the tool builds loading-control normalization, replicate statistics, a publication figure, slides and a Methods paragraph. If you only have the image, it can quantify it directly.

Can I upload FISH images from Zeiss or Leica microscopes?

Yes — composite images (PNG, JPG, TIFF), or per-channel TIFF exports (_ch00, _c1, _DAPI …) uploaded together are merged automatically. 16-bit and OME-TIFF are supported. Export .czi / .lif originals to TIFF first.