Lab data analysis guides
Step-by-step explanations, with worked examples, of how to analyze lab results correctly — grouped by field like the tools menu. Each guide links to a free tool that does the calculation for you.
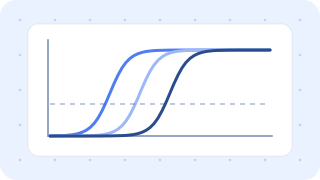
Lab quantification & images
qPCR, western blot and fluorescence microscopy into numbers and figures
qPCR
How to Calculate qPCR ΔΔCtA step-by-step guide to the 2^-ΔΔCt (Livak) method for qPCR relative quantification — ΔCt, ΔΔCt and fold change with a worked example, replicates and common mistakes.ΔΔCt vs the Pfaffl MethodHow to get primer efficiency from a standard-curve slope (E = 10^(-1/slope)), the Pfaffl equation, and a worked comparison showing how much ΔΔCt changes when efficiency differs.Choosing qPCR Reference GenesWhat makes a good qPCR reference (housekeeping) gene, how to check its stability across conditions, and why MIQE recommends two or more genes combined by geometric mean.qPCR Replicates and StatisticsHow to count n in qPCR (technical vs biological replicates), why statistics go on ΔCt or log2 fold change, choosing t-tests or ANOVA, and SD vs SEM error bars.qPCR TroubleshootingCauses, decision rules and fixes for common qPCR problems: late Ct, NTC amplification, technical-replicate spread, multiple melt peaks and gDNA contamination — as a checklist.
Western blot
Western Blot DensitometryThe full western blot densitometry workflow — integrated density, background subtraction, loading-control normalization, values relative to a reference lane, and replicate statistics — with a worked example.7 Common Western Blot Quantification MistakesSeven common mistakes that distort western blot quantification — saturated bands, quantifying adjusted images, saturated loading controls, inconsistent box sizes and more — and how to avoid them.Western Blot Figures for PublicationJournal rules for western blot figures: acceptable brightness adjustments, dividing lines when lanes are rearranged, molecular-weight markers, submitting uncropped originals, and common reviewer flags.
FISH · Microscopy
FISH Signal Counting and RatiosPrinciples for counting target and control probe signals in FISH images, a ratio example, handling clusters and overlapping (fusion) signals, and pitfalls with multi-color probes.Exporting Microscope Images for AnalysisHow to export Zeiss (ZEN) and Leica (LAS X) microscope images for quantitative analysis: keep the original format, per-channel 16-bit TIFF, z-stacks, and pitfalls like display adjustments and burned-in annotations.
Statistics & calculations
Choosing tests, IC50, standard curves
t-test, ANOVA or Mann–Whitney? How to Choose a Statistical Test for Lab DataOne table for choosing between t-test, Welch, paired t-test, ANOVA (Tukey, Dunnett), Mann–Whitney and Kruskal–Wallis by number of groups, pairing, normality and variance — plus pitfalls at n = 3.How to Calculate IC50Converting MTT/CCK-8 absorbance to viability, the four 4PL parameters (top, bottom, IC50, Hill slope), reading the 95% confidence interval, relative vs absolute IC50, concentration design and common mistakes.Standard Curves for BCA, Bradford and ELISAChoosing linear, quadratic or 4PL fits for BCA, Bradford and ELISA standard curves; blank subtraction, standard recovery (80–120%), out-of-range samples, dilution factors and western blot loading volumes.
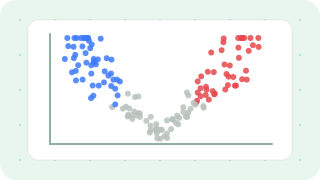
NGS & sequencing
Reading RNA-seq DEG results and plots
How to Read RNA-seq DEG ResultsWhat log2 fold change, p-value, FDR (padj) and baseMean mean in RNA-seq results, how to choose DEG cut-offs, replicates and low-expression filters, and common mistakes such as Excel mangling gene names.How to Interpret Volcano Plots, Heatmaps and PCA in RNA-seqHow to read volcano plots, clustering heatmaps (z-scores), PCA, sample correlation and Venn diagrams from RNA-seq, how to spot outliers and batch effects, and what to do next (GO, KEGG, GSEA).
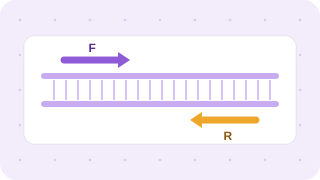
Molecular biology
Primer design, BLAST, cloning
How to Design PCR PrimersLength, GC, Tm and 3′-end rules for PCR primers, avoiding primer dimers and hairpins, how qPCR primers (product size, exon junctions, efficiency) differ from cloning primers (restriction sites, Gibson overlaps), plus ordering and resuspension.How to Use NCBI Primer-BLASTWhat to enter in each section of NCBI Primer-BLAST (template, primers, product size, exon junction, database, organism), how to read intended versus unintended products in the results, and common mistakes.How to Read BLAST ResultsWhich NCBI BLAST program to choose (megablast, blastn, blastn-short), picking a database, what E-value, percent identity, query cover and max score mean and how to judge them, plus checking Sanger sequencing and aligning two sequences.Cloning Methods ComparedHow restriction cloning, Gibson/HiFi/In-Fusion assembly, Golden Gate, TA/TOPO and Gateway work, compared on scars, multi-fragment assembly, cost and time — plus which to choose, how to verify clones (colony PCR, diagnostic digest, sequencing) and common failures.