t-test, ANOVA or Mann–Whitney: which test should you use?
A statistical test is chosen almost entirely by four questions: how many groups, are the data paired, are the values roughly normal, and do you compare with a control only or all pairs? This guide walks through them in that order.
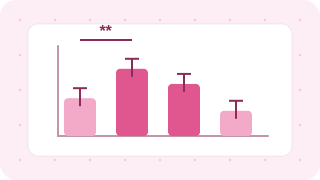
Paste values and answer two questions — the right test is chosen and explained, with a graph showing asterisks.
Open the group comparison tool →1. The whole choice in one table
| Situation | Roughly normal | Not normal |
|---|---|---|
| 2 groups, different samples | Welch t-test (recommended) | Mann–Whitney U |
| 2 groups, same subjects before/after | paired t-test | Wilcoxon signed-rank |
| 3+ groups, vs control only | ANOVA + Dunnett | Kruskal–Wallis + Dunn |
| 3+ groups, all pairs | ANOVA + Tukey | Kruskal–Wallis + Dunn |
| 3+ groups, very unequal variances | Welch ANOVA + Games–Howell | Kruskal–Wallis + Dunn |
Running several t-tests across three or more groups multiplies chance “significant” results by the number of comparisons. That is why ANOVA with a post-hoc test (Tukey, Dunnett) is used.
2. Why Welch’s t-test is the default
The classic Student t-test assumes both groups spread equally (equal variances). Treated groups often spread more than controls, so this assumption breaks often. Welch’s t-test stays accurate when variances differ and gives nearly the same answer when they are equal, so it is the recommended default.
3. Cautions at n = 3
- Normality tests are unreliable. With three values Shapiro–Wilk almost always says “normal”. Use parametric tests (t-test, ANOVA), and log-transform data that are typically skewed (fold changes, concentrations).
- Non-parametric tests cannot reach significance at n = 3. The smallest possible p-value for a 3-vs-3 Mann–Whitney test is 0.1 — even perfectly separated groups cannot give p < 0.05.
- Adding biological replicates helps more than any statistical technique.
4. Tukey or Dunnett?
Dunnett compares each treatment with a single control. Fewer comparisons mean more power on the same data — use it when the question is “effect versus control”, such as dose series. Tukey compares every pair; use it when differences between treatments (is drug A stronger than drug B?) matter too.
5. Common mistakes
- Counting technical replicates as n: average wells from the same sample into one value. (Replicates and statistics)
- Judging from SEM bars: non-overlapping SEM bars can still be non-significant, and overlapping ones significant. Decide from the test.
- Writing p > 0.05 as “no difference”: the accurate wording is “this experiment could not confirm a difference”.
- Switching tests after seeing the results: choose the test from the design, in advance.
Paste values and answer two questions — the right test is chosen and explained, with a graph showing asterisks.
Open the group comparison tool →