How to calculate qPCR ΔΔCt: the 2−ΔΔCt method step by step
The 2−ΔΔCt method corrects the target gene’s Ct with a reference gene and then compares it with the control to answer “how many-fold is expression changed versus control?” Remember that one Ct cycle is roughly a two-fold difference and the rest follows.
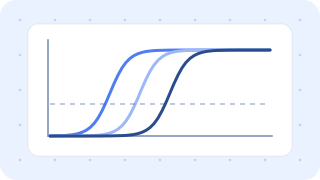
Paste Ct values or load an instrument file — ΔΔCt, fold change, t-tests and charts are calculated for you.
Open the qPCR tool →1. What you need
- For each sample, the Ct of the target gene and the Ct of a reference gene (e.g. GAPDH, ACTB).
- Average technical replicates (the same sample in several wells) first, so each sample has one Ct per gene.
- Decide which group is the control (calibrator).
2. Four steps
ΔCt tells you how many cycles later the target amplifies than the reference; a smaller ΔCt means more expression. A negative ΔΔCt means expression increased versus control.
3. Worked example
A textbook example: macrophages treated with LPS, measuring the inflammatory gene IL6.
| Group | GAPDH Ct | IL6 Ct | ΔCt | ΔΔCt | Fold change |
|---|---|---|---|---|---|
| Control | 18.2 | 28.4 | 10.2 | 0 | 1.0 |
| LPS | 18.3 | 24.4 | 6.1 | −4.1 | 17.1 |
For LPS, ΔΔCt = 6.1 − 10.2 = −4.1, so fold change = 24.1 ≈ 17.1. Because the GAPDH Ct barely moved, almost all of the 4-cycle drop in IL6 Ct shows up in the result.
4. Assumptions
- Primer efficiency close to 100% (doubling each cycle); 90–110% is usually acceptable. If efficiencies differ a lot, use the Pfaffl method.
- The reference gene must not change with treatment. If the reference Ct shifts between conditions, the result is distorted (how to choose reference genes).
5. With replicates
With several biological replicates, compute ΔΔCt and fold change for each sample, using the mean ΔCt of the control samples as the reference. The control samples themselves then scatter around 1 — that is the control’s variability.
For plates run on different days, normalize each plate to its own control before combining. Run statistics on ΔCt or log2 fold change, not on fold change itself (replicates and statistics).
6. Common mistakes
- Taking the arithmetic mean of fold changes. Fold change is asymmetric (0.5× and 2× are equal-sized changes); average on the log2 scale and convert back (geometric mean).
- Counting technical replicates as n. One sample measured three times is n = 1.
- Using Ct values above 35 as-is. Weak amplification is noisy (qPCR troubleshooting).
- A single control sample. Its random deviation leaks into every result.
Paste Ct values or load an instrument file — ΔΔCt, fold change, t-tests and charts are calculated for you.
Open the qPCR tool →