How to read RNA-seq DEG results: fold change, p-value and FDR
A DEG (differentially expressed gene) is a gene whose expression changes between two conditions by enough and reliably enough that chance is an unlikely explanation. So there are always two criteria: “how much did it change?” (fold change) and “can we trust it?” (p-value, FDR).
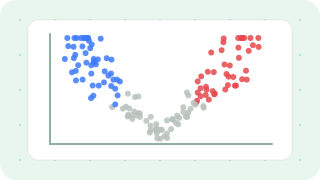
Upload a report spreadsheet or DESeq2 table — DEGs are selected with recommended cut-offs, and counts and charts update instantly as you change them.
Open the RNA-seq tool →1. Reading the columns
Whether it is a sequencing-service report or DESeq2/edgeR output, the key columns are nearly the same.
| Column (examples) | Meaning |
|---|---|
| log2FoldChange · logFC | log2 of treated ÷ control expression. Positive = up, negative = down |
| Fold change | The ratio itself (2 = two-fold). Some reports write a decrease as 0.5, others as −2 |
| pvalue · PValue | p-value of the test for that single gene |
| padj · FDR · q-value | The p-value adjusted for testing many genes at once |
| baseMean · logCPM · AveExpr | Average expression. The lower it is, the less stable the estimate |
| Normalized data · CPM · TPM | Expression values adjusted for sequencing depth between samples |
Check the direction of the comparison first. “B/A” means B relative to A. If control and treatment are swapped, every up becomes down.
2. Fold change and log2FC
| Change | Fold change | log2FC |
|---|---|---|
| 4-fold up | 4 | 2 |
| 2-fold up | 2 | 1 |
| No change | 1 | 0 |
| Halved | 0.5 (or −2) | −1 |
| Down to a quarter | 0.25 (or −4) | −2 |
On the log2 scale, increases and decreases are symmetric around 0, which makes charts and averages accurate. The most common cut-off is 2-fold (|log2FC| ≥ 1); 1.5-fold (0.585) is sometimes used for tissues or mild treatments with small effects.
3. p-value or FDR — which to use
Test 20,000 genes at p < 0.05 and about 1,000 (5%) come out significant by chance even if nothing changed. The FDR (Benjamini–Hochberg) adjusts p-values so that the proportion of false positives among the selected genes stays below the cut-off.
| Cut-off | When |
|---|---|
| FDR (padj) < 0.05 | The default for papers and talks; recommended with DESeq2/edgeR |
| p-value < 0.05 | Common in service reports; for exploratory screening, or when few replicates leave almost nothing after FDR |
Whichever you use, state the cut-off exactly in the Methods. With a p-value cut-off, describe the genes as “candidates” and validate them, for example by qPCR.
4. Minimum expression and replicates
- Barely expressed genes swing to large fold changes from a few reads (e.g. 1 → 4 reads = 4-fold). Filtering out genes with low mean expression first stabilizes the results (e.g. CPM ≥ 1 in at least one group).
- Three or more replicates per group are recommended. With two the variance estimate is unstable; with one no p-value can be computed and only fold change is left.
- Replicates must be biological (independent animals or cultures). Sequencing the same RNA twice is not replication. (Replicates and statistics)
5. Common mistakes
- Excel turning gene names into dates: legacy SEPTIN and MARCH names (SEPT2, MARCH1, …) become “2-Sep” or “1-Mar”. Import that column as text when opening a CSV.
- t-tests on RPKM/TPM: these are not normalized for between-sample comparison, so the statistics are off. Use count-based tools (DESeq2, edgeR).
- Changing cut-offs until something shows up: fix the criteria before the analysis, and document any change.
- Comparing DEG counts only: replicate numbers and sequencing depth change DEG counts, so comparing them is meaningful only with the same design.
Upload a report spreadsheet or DESeq2 table — DEGs are selected with recommended cut-offs, and counts and charts update instantly as you change them.
Open the RNA-seq tool →