7 common western blot quantification mistakes
When quantification looks wrong, the cause is usually the image and the experiment, not the math. Avoiding these seven mistakes goes a long way.
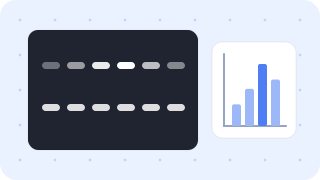
Saturated bands and uneven loading controls are flagged automatically, and display adjustments never touch the quantified values.
Open the western blot tool →1. Quantifying saturated bands
Once pixels hit the maximum (255 in 8-bit), more protein no longer means more signal, so strong bands are underestimated and differences shrink. Capture several exposures and pick one in which even the darkest band is unsaturated; save in 16-bit if possible.
2. Quantifying an adjusted image
Levels and gamma change pixel values; gamma (non-linear) in particular changes weak and strong bands differently and distorts ratios. Always quantify the original.
3. A saturated or non-linear loading control
Abundant loading controls such as β-actin and GAPDH saturate easily, and then they cannot correct loading differences. Lower the load or antibody concentration, and consider total-protein normalization (stain-free gels, Ponceau S), which many journals now favor.
4. Different box sizes per lane
Bigger boxes include more background; smaller ones clip the band. Use the same width and height for every lane of a protein.
5. No or inconsistent background subtraction
Skipping background subtraction compresses differences between weak bands. Use one method consistently within an experiment and report it (background methods compared).
6. Comparing raw values across blots
Transfer, antibody and exposure differ between blots. Compare across blots only with values normalized to each blot’s reference lane.
7. Saving as JPEG or taking screenshots
JPEG compression alters band edges and screenshots include display adjustments. Use the instrument’s original file or TIFF for analysis.
Saturated bands and uneven loading controls are flagged automatically, and display adjustments never touch the quantified values.
Open the western blot tool →