Using standard curves for BCA, Bradford and ELISA correctly
A standard curve turns absorbance of standards with known concentrations into an absorbance → concentration conversion. The keys are choosing the right curve for the assay and checking that samples fall inside the standard range.
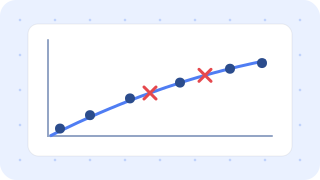
Paste standards and samples — the right curve is chosen, concentrations calculated, out-of-range samples flagged and western blot loading volumes worked out.
Open the standard curve calculator →1. Choosing the curve by assay
| Assay | Recommended curve | Why |
|---|---|---|
| BCA | Quadratic (linear over narrow ranges) | Bends slightly at high concentrations |
| Bradford | Quadratic | Bends more |
| ELISA | 4PL | Flat at low, saturating at high concentrations — an S shape |
Do not rely on R² alone: check that each standard, calculated back from the curve, is within 80–120% of its true value (recovery). A curve with R² = 0.99 can still be badly off at the low end.
2. Blanks and range
- Subtract the zero standard (blank) from every reading.
- If a sample reads above the highest standard, it is off the curve and cannot be calculated — dilute further and re-measure.
- Below the lowest standard, accuracy drops — dilute less or use a more sensitive assay.
- If replicate wells have a CV above 15%, check pipetting and bubbles.
3. Dilution factors — an example
Multiply the concentration read from the curve by the dilution factor to get the original sample concentration.
| Sample | Read from curve | Dilution | Original |
|---|---|---|---|
| Cell lysate | 436 µg/mL | ×5 | 2,180 µg/mL = 2.18 µg/µL |
4. Western blot loading volumes
Example: to load 20 µg from a lysate at 2.18 µg/µL, take 9.2 µL. For a 20 µL final volume with 4× sample buffer, add 5 µL of buffer and 5.8 µL of water. Equal µg in every lane comes before loading-control normalization. (Western blot densitometry)
5. Common mistakes
- Standards in a different buffer from samples: detergents and reducing agents in lysis buffers change BCA colour development. Dilute standards in the same buffer.
- Extrapolating beyond the curve: reading values above the top standard by extending the curve is badly inaccurate.
- Reusing an old curve: run a new standard curve on every plate and in every experiment.
Paste standards and samples — the right curve is chosen, concentrations calculated, out-of-range samples flagged and western blot loading volumes worked out.
Open the standard curve calculator →