qPCR troubleshooting checklist
Before worrying about the calculation, check whether the raw data can be trusted. These five checks explain most strange results.
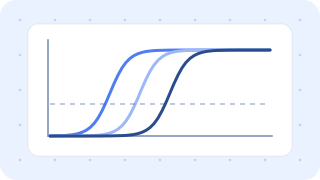
Load an instrument file: NTCs are skipped automatically, and outlier replicates, Ct ≥ 35 and large spreads are flagged.
Open the qPCR tool →1. Ct above 35
With very little template, the start of amplification becomes stochastic (Poisson noise) and replicates spread widely. Treat Ct ≥ 35 as “very low or absent” and flag it if you quantify it; the real fix is more cDNA or less dilution.
2. The NTC amplified
- Check the melt curve: a lower-temperature peak than the sample suggests primer dimer; the same temperature suggests contamination.
- If the NTC is 5+ cycles later than your samples, the impact is usually small (about 3% or less).
- If contamination is likely, replace reagents, water and pipettes and separate work areas.
3. Technical replicates disagree
Replicates of one sample usually fall within 0.2–0.3 Ct. A spread above 0.5 Ct points to pipetting, bubbles or evaporation.
To drop an outlier, apply a pre-defined rule to every sample, e.g. “with 3+ replicates, drop one value more than 0.5 Ct from the median” — never pick values after seeing the result.
4. Several melt-curve peaks
SYBR Green binds any double-stranded DNA, so unwanted products also give signal. Multiple peaks mean non-specific products or primer dimers — redesign primers, adjust annealing temperature, or check product size on a gel.
5. Suspected genomic DNA
Amplification in a no-RT control (no reverse transcriptase) means gDNA contamination. Use DNase treatment or design primers across exon–exon junctions.
Checklist
- □ NTC and no-RT controls were run
- □ Single melt-curve peak
- □ Technical replicates within 0.5 Ct (exceptions handled by a rule)
- □ Quantified Ct values below 35
- □ Reference gene stable across groups
Load an instrument file: NTCs are skipped automatically, and outlier replicates, Ct ≥ 35 and large spreads are flagged.
Open the qPCR tool →