How to interpret volcano plots, heatmaps and PCA
RNA-seq charts answer two questions: “Are the samples trustworthy?” (PCA, correlation) and “What changed, and by how much?” (volcano, heatmap, Venn). Check the first question before interpreting the second.
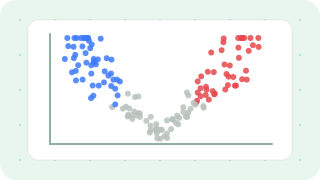
Upload a file to draw volcano, scatter, heatmap, PCA, correlation and Venn plots instantly, and export DAVID/GSEA inputs and slides.
Open the RNA-seq tool →1. PCA — check sample quality first
PCA summarizes the expression pattern of thousands of genes in two dimensions. The % on each axis is how much of the total variation that axis explains.
- Replicates should cluster together and groups should separate. If PC1 splits treated from control, the treatment is the largest source of variation.
- A sample sitting far from its group may have an RNA quality or library problem. If it is also low in the correlation plot, consider excluding it (and record why).
- If samples split by date or batch instead of group, you have a batch effect. Correct for it by adding batch to the statistical model.
2. Sample correlation
Pearson r between samples shows how similar their overall expression patterns are. Replicates of the same cell line or tissue are usually very high (r > 0.95), and replicates of the same group should correlate best with each other. If one sample is lower across the board, check whether it is the same outlier seen in the PCA.
3. Volcano plot
The x-axis is log2 fold change (size of the change); the y-axis is −log10(p) (confidence). Higher means smaller p (−log10 2 = p 0.01, 3 = p 0.001).
- Upper right = strongly and reliably up · upper left = strongly and reliably down · bottom centre = unchanged
- Vertical dashed lines = fold change cut-off; horizontal dashed line = p cut-off. Points beyond both are DEGs.
- High but central points change little but very consistently. Judge biological relevance together with the size of the change.
4. Heatmap (z-scores)
Heatmaps color each gene by its z-score (how many standard deviations from that gene’s own mean). Red and blue therefore mean “relatively high or low for this gene”, not absolute expression compared between genes.
- The tree on the left (dendrogram) groups genes with similar patterns. Genes that rise and fall together often share a pathway.
- Clustering samples as well shows whether replicates group together — another consistency check.
- Usually drawn with the top 50–100 DEGs by p-value; too many genes blur the pattern.
5. Venn diagrams and next steps
With several comparisons (e.g. drugs A and B each versus control), a Venn diagram separates shared and specific DEGs. Genes rescued by an inhibitor sit in the region “changed by the treatment but not by treatment + inhibitor”.
Once you have a DEG list, move on to functional analysis: put the up and down lists separately into DAVID, Enrichr or g:Profiler for GO and KEGG pathways, and use GSEA, which ranks all genes without a cut-off, to catch pathways made of many small changes.
Upload a file to draw volcano, scatter, heatmap, PCA, correlation and Venn plots instantly, and export DAVID/GSEA inputs and slides.
Open the RNA-seq tool →